apex-07L4x000.log — 18,442 lines
161.0 APEX_CODE,FINE;APEX_PROFILING,INFO;CALLOUT,INFO;DB,FINEST;SYSTEM,DEBUG;VALIDATION,INFO;WORKFLOW,INFO
212:04:51.0 (12034879)|EXECUTION_STARTED
312:04:51.0 (12041245)|CODE_UNIT_STARTED|[EXTERNAL]|01q4x00000KZ1|CaseTrigger on Case trigger event BeforeUpdate|__sfdc_trigger/CaseTrigger
412:04:51.0 (13002145)|SOQL_EXECUTE_BEGIN|[14]|Aggregations:0|SELECT Id,Status,OwnerId FROM Case WHERE Id IN :caseIds
512:04:51.0 (14882013)|SOQL_EXECUTE_END|[14]|Rows:1
612:04:51.0 (15110023)|HEAP_ALLOCATE|[71]|Bytes:3
712:04:51.0 (16204412)|METHOD_ENTRY|[12]|01p4x00000Aa2|CaseHandler.beforeUpdate()
812:04:51.0 (17334129)|USER_DEBUG|[88]|DEBUG|Processing 1 case record
912:04:51.0 (18772301)|SOQL_EXECUTE_BEGIN|[34]|Aggregations:0|SELECT Id FROM Contact WHERE AccountId=:accId
1012:04:51.0 (19551044)|SOQL_EXECUTE_END|[34]|Rows:6
1112:04:51.0 (20114882)|ENTERING_MANAGED_PKG|[EXTERNAL]|vlocity_cmt
1212:04:51.0 (21887310)|CODE_UNIT_STARTED|[EXTERNAL]|vlocity_cmt.TriggerHandler
1312:04:51.0 (22440190)|DML_BEGIN|[52]|Op:Update|Type:Case|Rows:1
1412:04:51.0 (23998120)|DML_END|[52]
1512:04:51.0 (24550021)|CODE_UNIT_STARTED|[EXTERNAL]|Workflow:Case
1612:04:51.0 (25110933)|FLOW_START_INTERVIEWS_BEGIN|1
1712:04:51.0 (26773410)|SOQL_EXECUTE_BEGIN|[8]|Aggregations:0|SELECT Id,Email FROM User WHERE Id=:ownerId
1812:04:51.0 (27554120)|SOQL_EXECUTE_END|[8]|Rows:1
1912:04:51.0 (28991200)|LIMIT_USAGE_FOR_NS|(default)|SOQL: 41/100 | DML: 1/150 | CPU: 3204ms
2012:04:51.0 (29110044)|USER_DEBUG|[120]|DEBUG|Recursion guard: CaseTrigger re-entry #3
2112:04:51.0 (30557120)|CODE_UNIT_FINISHED|CaseTrigger on Case
2212:04:51.0 (31200410)|CUMULATIVE_LIMIT_USAGE
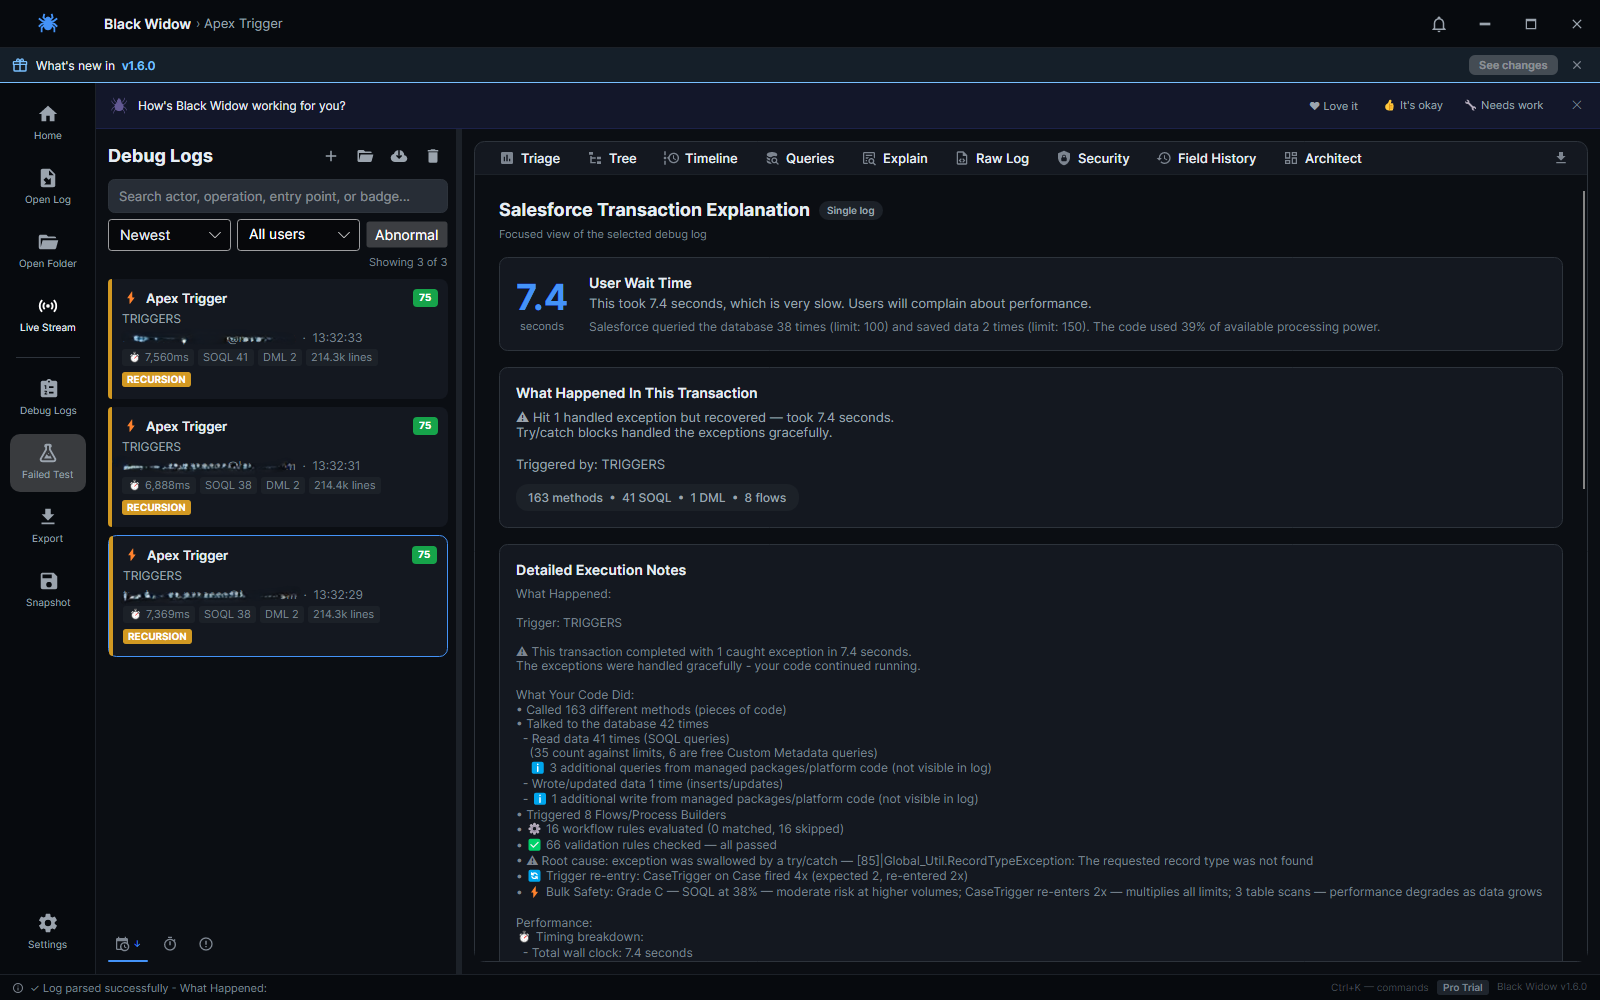
Reading raw logs in any text editor: open log 1, read thousands of lines, repeat 13 times.